
 Italian
  English
  Spanish
  French
  German
  Portuguese
  Dutch
Dutch  Thai
Thai PPF tells you how many photosynthetically useful photons a fixture emits each second. PPFD tells you how many of those photons reach each square meter of canopy each second. DLI combines average PPFD with hours of light to show the crop’s total daily dose. Commercial growers need all three: PPF to compare fixtures, PPFD to design coverage, and DLI to run the crop.
It is easy to confuse these metrics because they all count photons. They answer different questions, however. A high PPF does not guarantee good canopy coverage. A high center PPFD does not guarantee uniform growth. And the right PPFD for one photoperiod may deliver the wrong DLI for another.
For a commercial grow room, the practical sequence is simple:
- Set a crop and growth-stage DLI target.
- Choose a safe photoperiod for that crop.
- Calculate the average PPFD needed at canopy height.
- Select and lay out fixtures using full PPFD maps, not peak values alone.
- Measure the installed system and adjust height, spacing, or dimming.
This guide explains each step without relying on watts, lumens, or marketing claims
PPF, PPFD, and DLI at a Glance
| Metric | What it measures | gruppo | Best use | What it cannot tell you alone |
|---|---|---|---|---|
| PPF | Total photosynthetic photon output from a fixture | µmol/s | Comparing fixture output when the test method and spectral range match | Where the photons land or how uniform the canopy will be |
| PPFD | Photon flux reaching one square meter at a specific location and height | µmol/m²/s | Checking intensity and distribution at canopy level | The total light received over the day |
| dli | Total photosynthetic photons received per square meter each day | mol/m²/giorno | Setting and managing the crop’s daily light dose | Whether intensity is uniform or the photoperiod suits the crop |
The Design Lights Consortium’s horticultural technical requirements define PPF as a fixture’s total output from 400 to 700 nm and note that PPF contains no directional information. That last point matters: two fixtures can have the same PPF yet create very different PPFD maps. See the DLC horticultural technical requirements for the formal measurement framework.
What Is PPF?
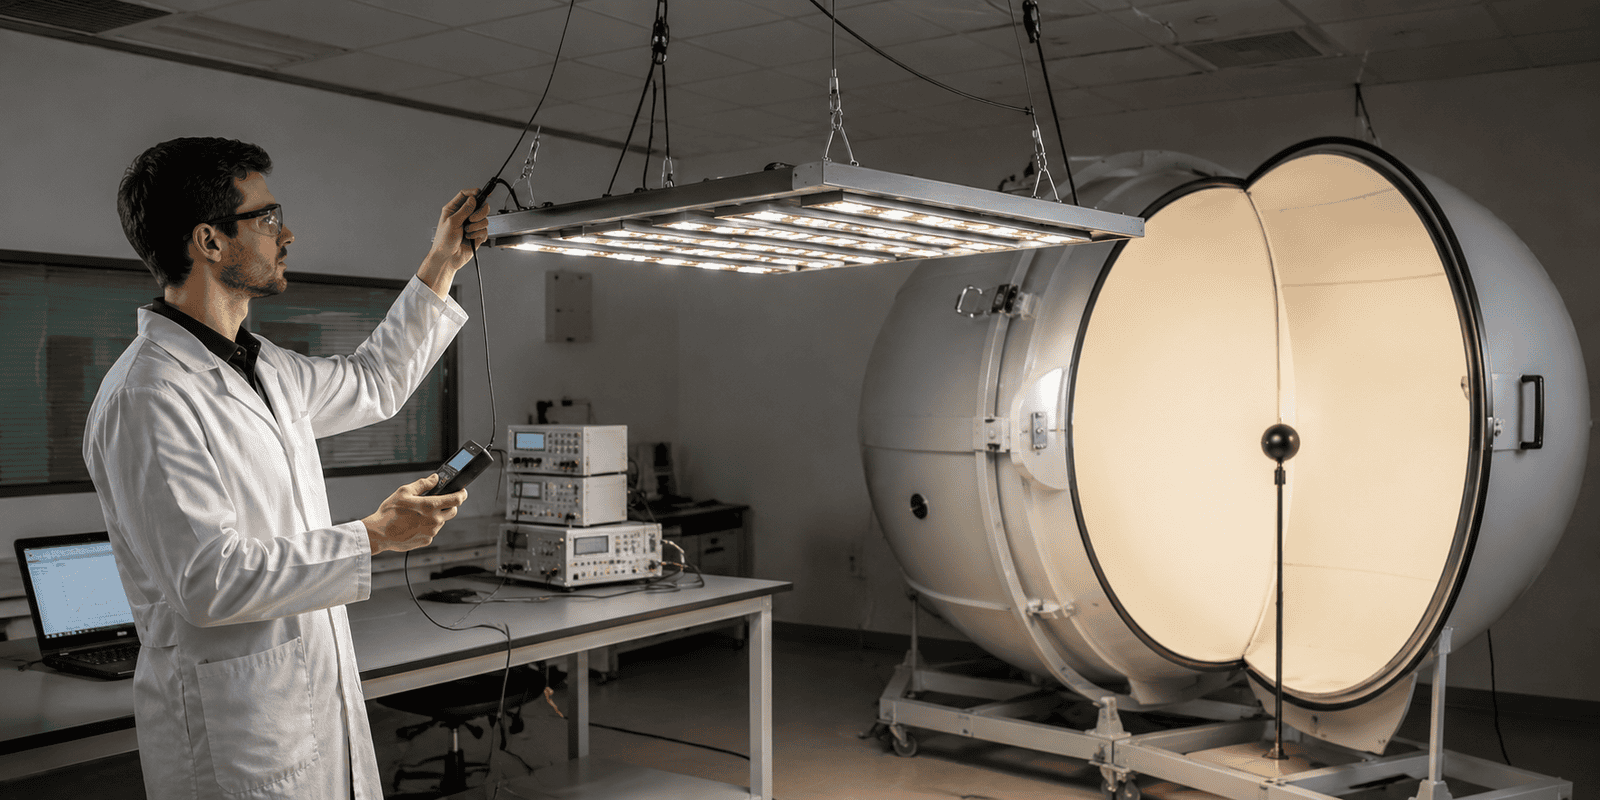
Photosynthetic photon flux, or PPF, is the total number of photons within the specified photosynthetic waveband that a fixture emits every second. Its unit is micromoles per second (µmol/s).
Think of PPF as the fixture’s total photon output. It is useful for comparing two luminaires only when both values were measured under comparable conditions. Check the spectral range, test standard, input voltage, operating temperature, and whether the value covers the complete fixture.
PPF does not describe the growing area. A 2,000 µmol/s fixture may produce a tight hotspot, a broad distribution, or substantial spill beyond the canopy. Optics, bar spacing, mounting height, reflectivity, and fixture spacing determine how much of that output reaches the crop.
PPF also works with electrical power to calculate photon efficacy:
Photon efficacy (µmol/J) = PPF (µmol/s) ÷ input power (W)
For example, a fixture producing 2,160 µmol/s while drawing 800 W has a photon efficacy of 2.7 µmol/J. Efficacy is important for operating cost, but it still does not show canopy uniformity.
What Is PPFD?
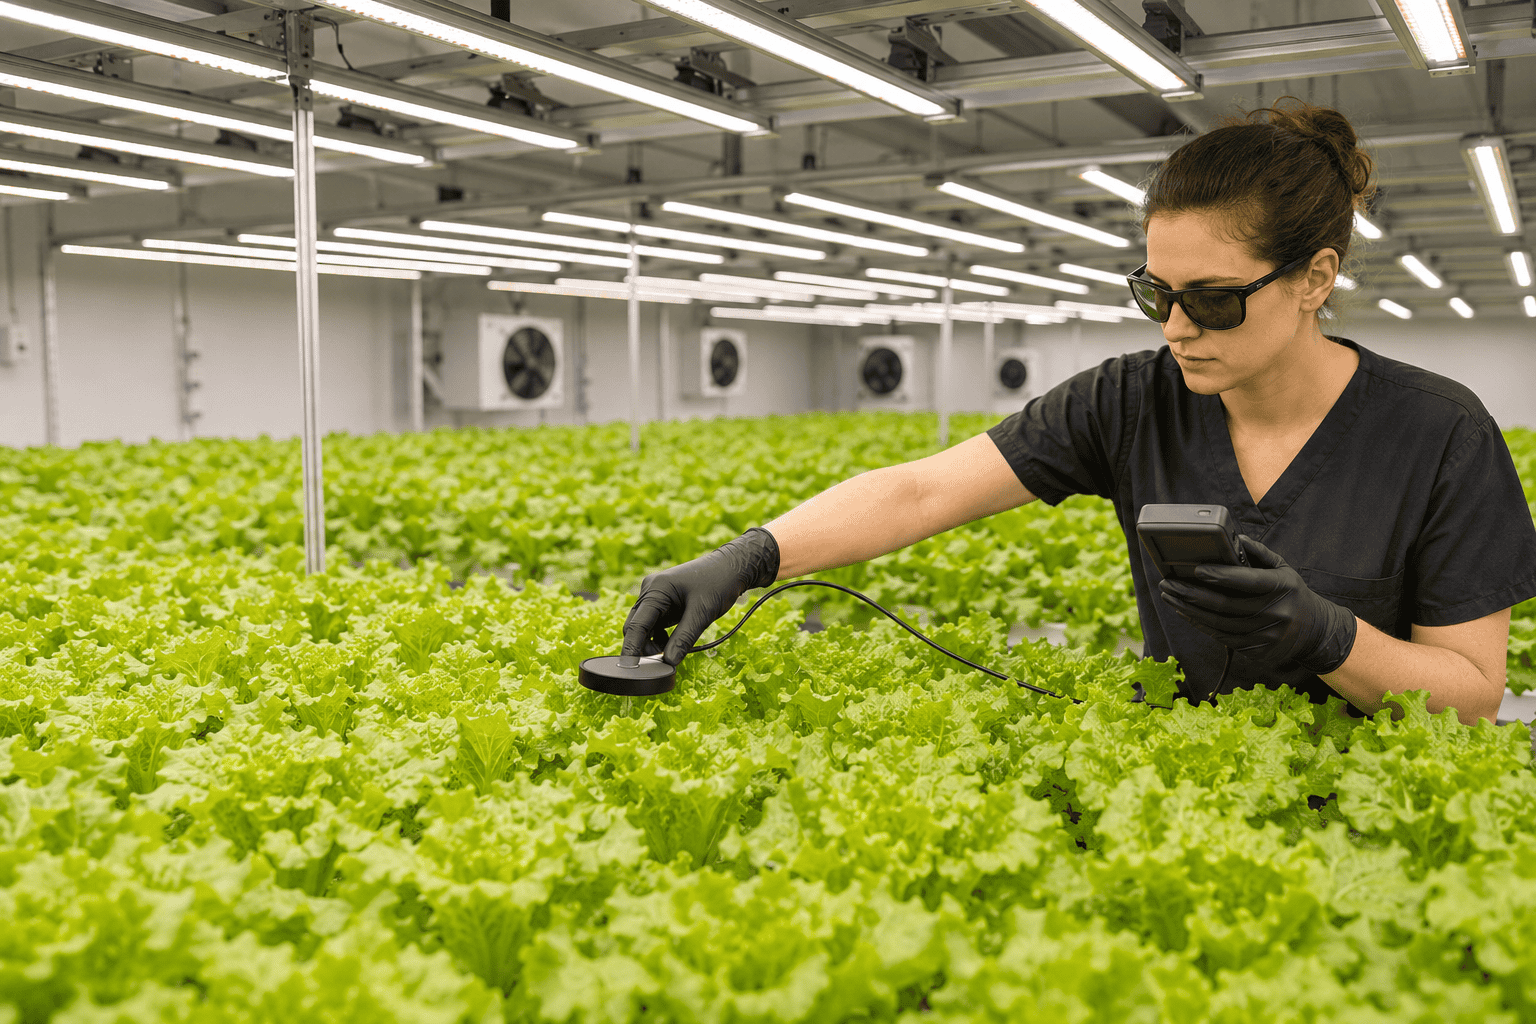
Photosynthetic photon flux density, or PPFD, measures how many photons reach one square meter every second. Its unit is µmol/m²/s.
PPFD is a measurement at a place, not a fixed fixture rating. Move the sensor, change the hanging height, add neighboring fixtures, or grow a taller canopy and the reading changes. That is why a single center measurement is not enough for a commercial layout.
A useful PPFD map should state:
- fixture model and quantity;
- input power or dimming level;
- mounting height measured from the sensor plane;
- test area dimensions;
- grid spacing and number of readings;
- average, minimum, and maximum PPFD; and
- wall or reflective-boundary conditions.
Peak PPFD is often the largest number on a product graphic. Average PPFD across the usable crop area is usually more useful for planning. Minimum PPFD and the min-to-average ratio reveal whether edge plants will be underlit.
Read Kingrowlight’s crop-by-crop PPFD guide after you understand the three metrics; it provides a practical starting point for matching intensity to crop and stage.
What Is DLI?
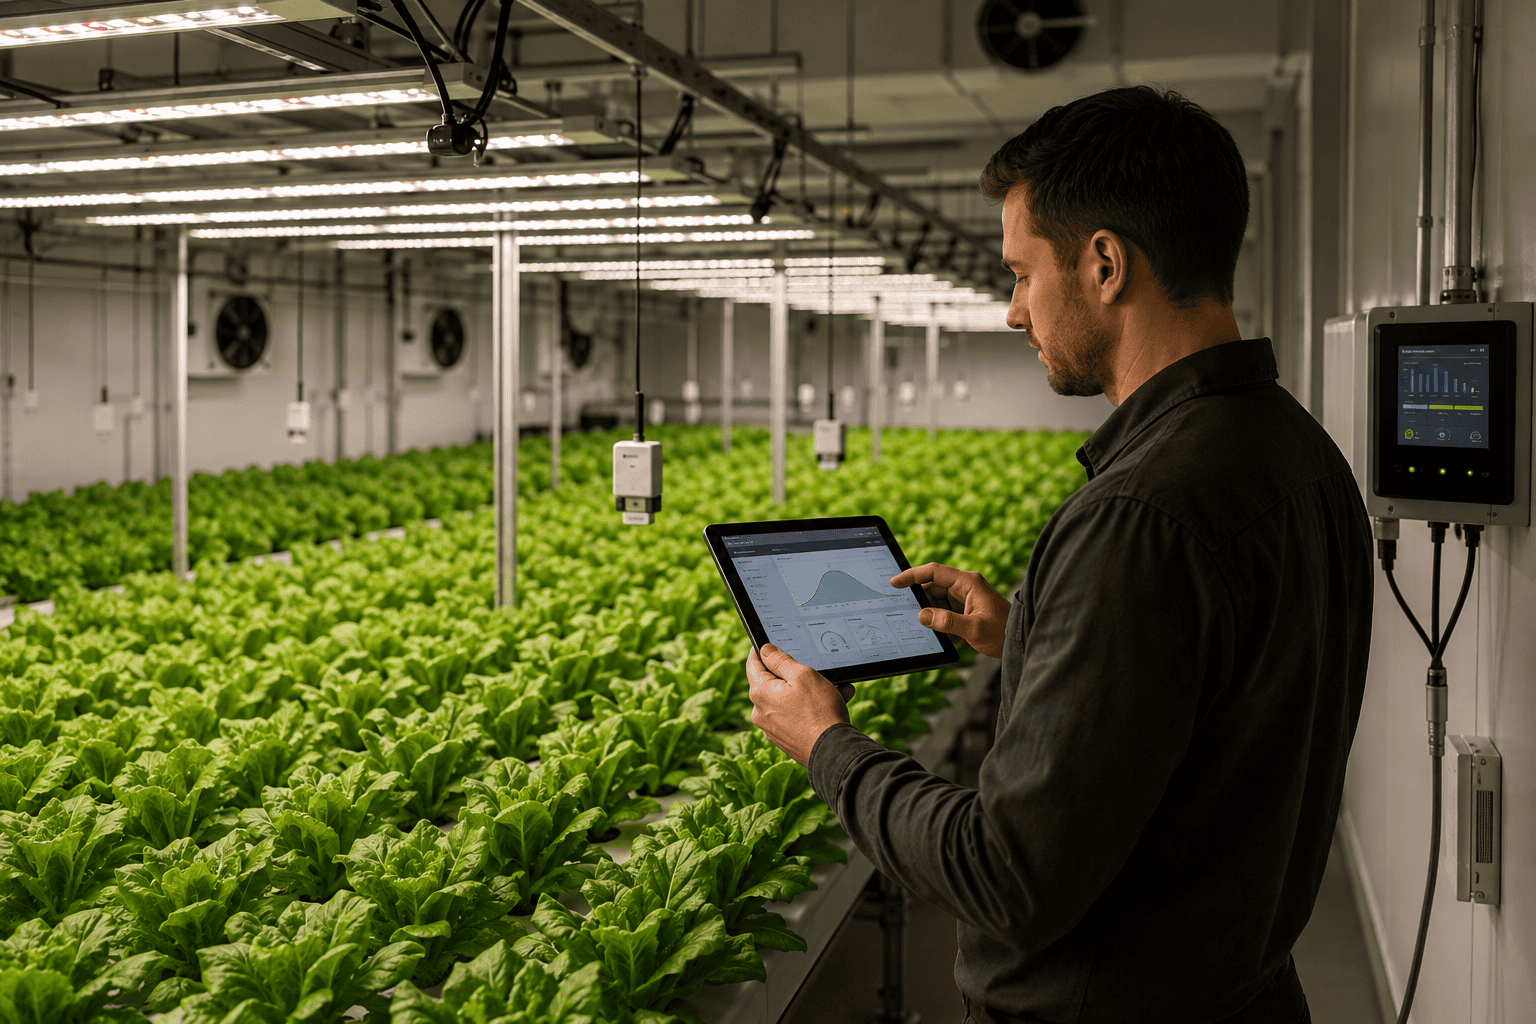
Daily light integral, or DLI, is the total number of photosynthetic photons received by one square meter during a day. Its unit is mol/m²/day. DLI combines light intensity and duration, so it is the best of these three metrics for expressing a daily crop-light target.
Under constant electric lighting:
DLI (mol/m²/day) = average PPFD (µmol/m²/s) × photoperiod (hours) × 0.0036
The conversion factor comes from 3,600 seconds per hour and 1,000,000 micromoles per mole. Apogee Instruments provides the full PPFD-to-DLI conversion and notes an important limitation: a single instantaneous reading cannot accurately represent a day of changing sunlight.
In a greenhouse, natural light changes minute by minute. Use a logging quantum sensor to integrate actual DLI, then use the lighting system to supply the shortfall. Michigan State University Extension also treats DLI as a core greenhouse-management metric in its light-management resources.
Quick DLI Reference Table for Constant Electric Light
| Average PPFD (µmol/m²/s) | 12 hours | 16 ore | 18 hours |
|---|---|---|---|
| 100 | 4.3 | 5.8 | 6.5 |
| 200 | 8.6 | 11.5 | 13.0 |
| 300 | 13.0 | 17.3 | 19.4 |
| 400 | 17.3 | 23.0 | 25.9 |
| 600 | 25.9 | 34.6 | 38.9 |
| 800 | 34.6 | 46.1 | 51.8 |
| 1,000 | 43.2 | 57.6 | 64.8 |
These are mathematical conversions, not universal crop recommendations. Cultivar, stage, temperature, CO₂, irrigation, nutrient availability, airflow, and disease pressure can all change the useful limit.
Worked Example: From Fixture PPF to Canopy DLI
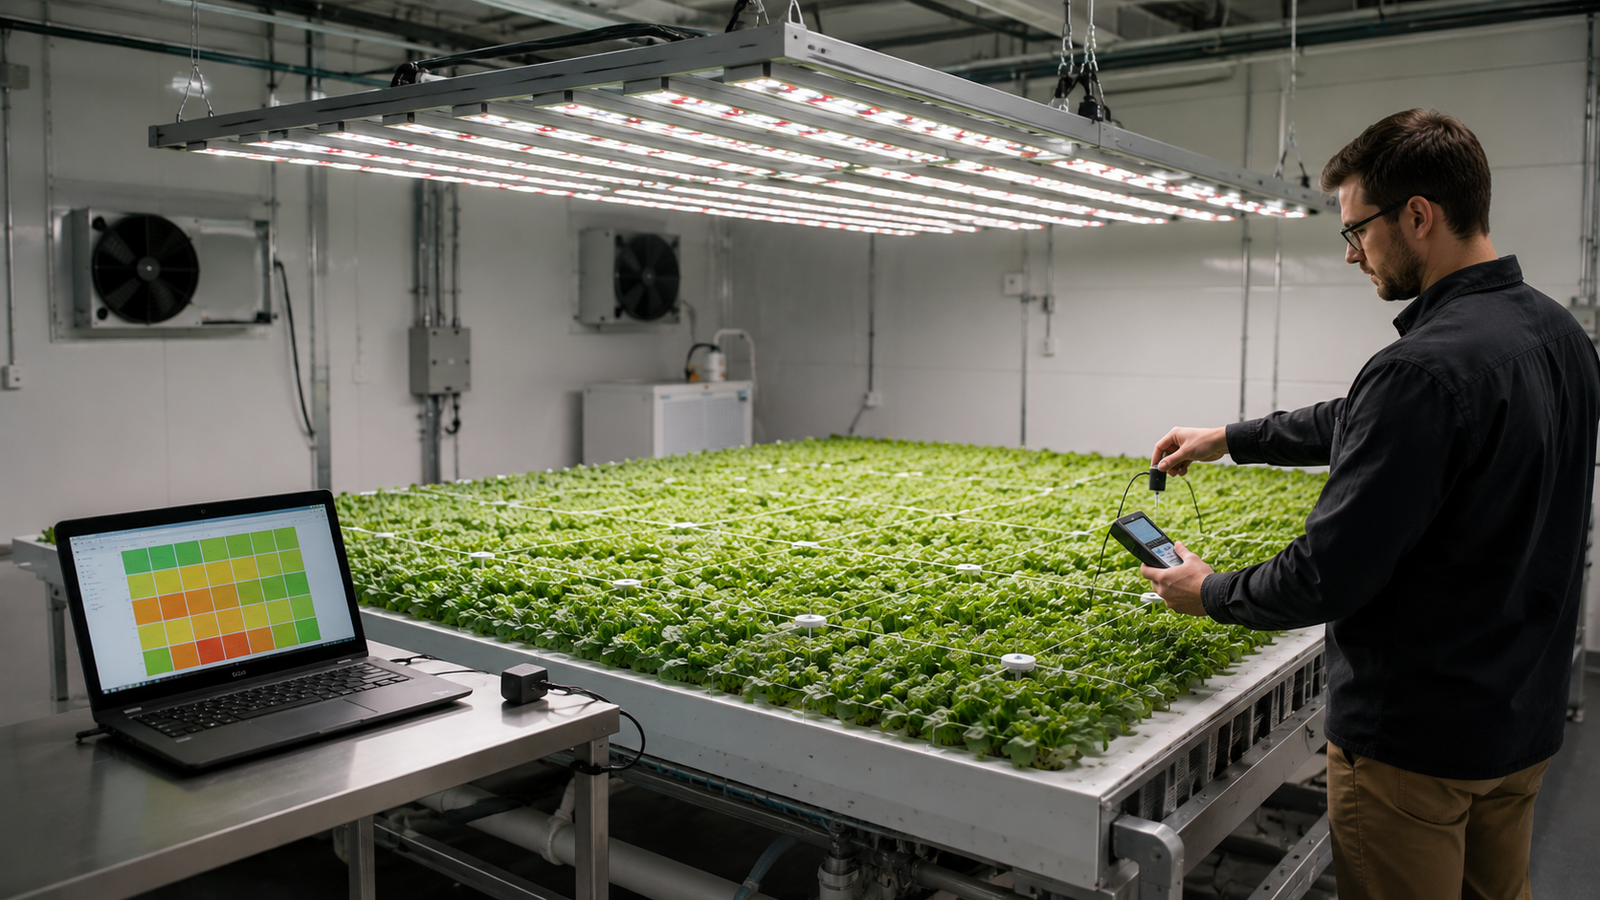
The Kingrowlight 600W/800W foldable LED grow light lists a typical PPF of 2,160 µmol/s for the 800W model and an efficacy of 2.7 µmol/J. How can a facility planner translate that number into a lighting decision?
Assume, only for this planning example, that:
- one fixture covers 2.25 m²;
- 75% of emitted photons reach that crop area; and
- distribution is perfectly uniform.
First estimate the delivered average PPFD:
Estimated average PPFD = 2,160 × 0.75 ÷ 2.25 = 720 µmol/m²/s
Then calculate DLI for a 12-hour photoperiod:
DLI = 720 × 12 × 0.0036 = 31.1 mol/m²/day
At 16 hours, the same average PPFD would provide:
DLI = 720 × 16 × 0.0036 = 41.5 mol/m²/day
This example shows why PPF alone is not a layout. The 75% delivery factor and perfect uniformity are assumptions, not product measurements. Real delivered PPFD depends on height, footprint, room boundaries, adjacent fixtures, and canopy reflectance. Use the model’s published PPFD map, then validate the installed result with a calibrated quantum sensor.
How to Measure PPFD Without Misleading Yourself
For a small rectangular test area, a 3 × 3 grid is a useful minimum. Larger rooms need more points. Keep the sensor level, place it at the actual canopy plane, and avoid shading it with your body.
- Warm the fixtures and stabilize their output.
- Set the intended mounting height and dimming level.
- Divide the crop footprint into equal grid cells.
- Take a reading at each defined point.
- Calculate average, minimum, and maximum PPFD.
- Repeat at representative locations, including room edges and fixture overlaps.
- Save the map with the model, height, power setting, date, and sensor used.
Do not compare a laboratory map with reflective walls to an open-rack installation without accounting for the different boundary conditions. Do not hold the sensor above the canopy for convenience; even a small height change can alter the reading.
How to Compare Grow-Light Specification Sheets
Commercial buyers should compare like with like. Before accepting a PPF or efficacy number, ask these questions:
- What wavelength range was integrated?
- Was the full luminaire tested by an independent laboratory?
- Is the reported wattage measured input power or nominal LED power?
- At what ambient temperature and input voltage was the test performed?
- Does the PPFD map show average, minimum, maximum, height, and footprint?
- Are the map and PPF value for the exact model being quoted?
Spectral boundaries deserve special attention. For example, the OEM/ODM LED grow-light specifications from SignliteLED list an 800W model at 2,160 µmol/s over 380–780 nm, while the DLC document cited above defines standard PPF over 400–700 nm. Those numbers should not be treated as automatically interchangeable. Ask both suppliers for reports using the same wavelength band and test method before making a direct output or efficacy comparison.
You can review Kingrowlight’s wider commercial LED grow light range to compare fixture formats. A foldable high-output fixture may suit a large open canopy, while linear bars can be easier to position in shallow multi-tier racks. The right form factor depends on the required PPFD map, clearance, airflow, cleaning access, and control strategy—not PPF alone.
Five Common PPF, PPFD, and DLI Mistakes
1. Buying the highest PPF without defining an area
Higher output is not automatically better. If photons spill outside the crop or create an unmanageable hotspot, additional PPF becomes wasted electricity and heat.
2. Using the center PPFD as the room average
The center value may be the maximum. Plan with a full grid, compare minimum and average values, and inspect overlap between fixtures.
3. Treating watts or lumens as plant-light measurements
Watts measure electrical input. Lumens weight light for human vision. Neither replaces a horticultural PPF test or canopy PPFD measurement.
4. Increasing PPFD without recalculating DLI
If PPFD rises while the photoperiod stays unchanged, DLI rises too. The crop may exceed the intended daily dose even when the instantaneous reading looks reasonable.
5. Ignoring natural sunlight in a greenhouse
Supplemental lighting adds to solar DLI. A fixed schedule can underlight the crop on dark days and waste electricity on bright days. Use an integrated light sensor and a control strategy based on the daily deficit.
Which Metric Should You Use for Each Decision?
Use PPF to compare total fixture output, provided the spectral range and test conditions match.
Use PPFD to design hanging height, spacing, overlap, dimming, and uniformity at the canopy.
Use dli to set the crop’s daily light program and coordinate intensity with photoperiod.
If you are designing for leafy greens, uniform moderate PPFD across every rack may matter more than extreme fixture output. If you are lighting a high-demand fruiting canopy, available height, thermal load, CO₂ strategy, and electrical capacity become more important. In both cases, start with DLI, calculate PPFD, and then select enough usable PPF to achieve the target efficiently.
Plan Your Lighting Around the Canopy, Not the Label
The best commercial lighting plan is not the fixture with the largest number on its datasheet. It is the system that delivers the required daily photons evenly, safely, and efficiently across the actual crop area.
Send Kingrowlight your crop, growth stage, canopy dimensions, rack or room height, target DLI, photoperiod, and available voltage. The team can use those inputs to recommend a fixture format and prepare a more relevant PPFD layout. Contact Kingrowlight for a lighting calculation.
Domande frequenti
What is the difference between PPF and PPFD?
PPF is the total photosynthetic photon output of a fixture, measured in µmol/s. PPFD is the photon density arriving at a surface, measured in µmol/m²/s. PPF describes the light source; PPFD describes light at the canopy.
Can I calculate PPFD directly from PPF?
Only as a rough planning estimate. You must know the illuminated area and estimate how much emitted light reaches it. Real PPFD also depends on optical distribution, mounting height, adjacent fixtures, room reflectance, and spill. Use a tested PPFD map and field measurements for final design.
Come faccio a calcolare DLI da PPFD?
For constant electric light, multiply average PPFD by photoperiod hours and 0.0036. For example, 400 µmol/m²/s for 16 hours equals 23.0 mol/m²/day. For sunlight or changing output, use a logging quantum sensor rather than one spot reading.
Is higher PPFD always better?
No. A crop can use only as much light as its genetics, stage, temperature, CO₂, water, nutrition, and environment allow. Excess PPFD can waste energy, create stress, or magnify other limitations.
Should I compare grow lights by µmol/J?
Photon efficacy is useful for comparing electrical conversion efficiency, but it is not enough by itself. Confirm the wavelength range and test method, then compare PPFD uniformity, controls, thermal design, reliability, certifications, and suitability for the crop area.
Where should a PPFD sensor be placed?
Place it level at the real canopy plane and measure multiple evenly spaced points. Record center, edge, and overlap areas. Avoid shading the sensor, and keep mounting height and dimming identical to normal operation.
